
Roberto Sibrian, a senior risk management and insurance student at Appalachian State University, recently detailed his experiences abroad in Bangalore, India. Sibrian is a member and co-director of marketing for the Walker College of Business' student chapter of Gamma Iota Sigma and a student participant in R.I.S.E. Research at Appalachian.
All throughout my academic career I had the desire to study abroad to help me expand my knowledge of the world and gain international business experience. Once I got offered the chance to go to Bangalore, India, I seized the opportunity immediately! Even before taking the course, I knew this experience would spark my interests. For quite some time, I have been fascinated with data analytics and its ability to impact companies' operational goals, risk management approaches and overall sustainability efforts.
Once we arrived in India, we were greeted with open arms and superb hospitality by the faculty, staff and master students of Kristu Jayanti College. We were welcomed with a ceremony where we got introduced to the program directors and the KJC students we were paired with for our respective case studies.
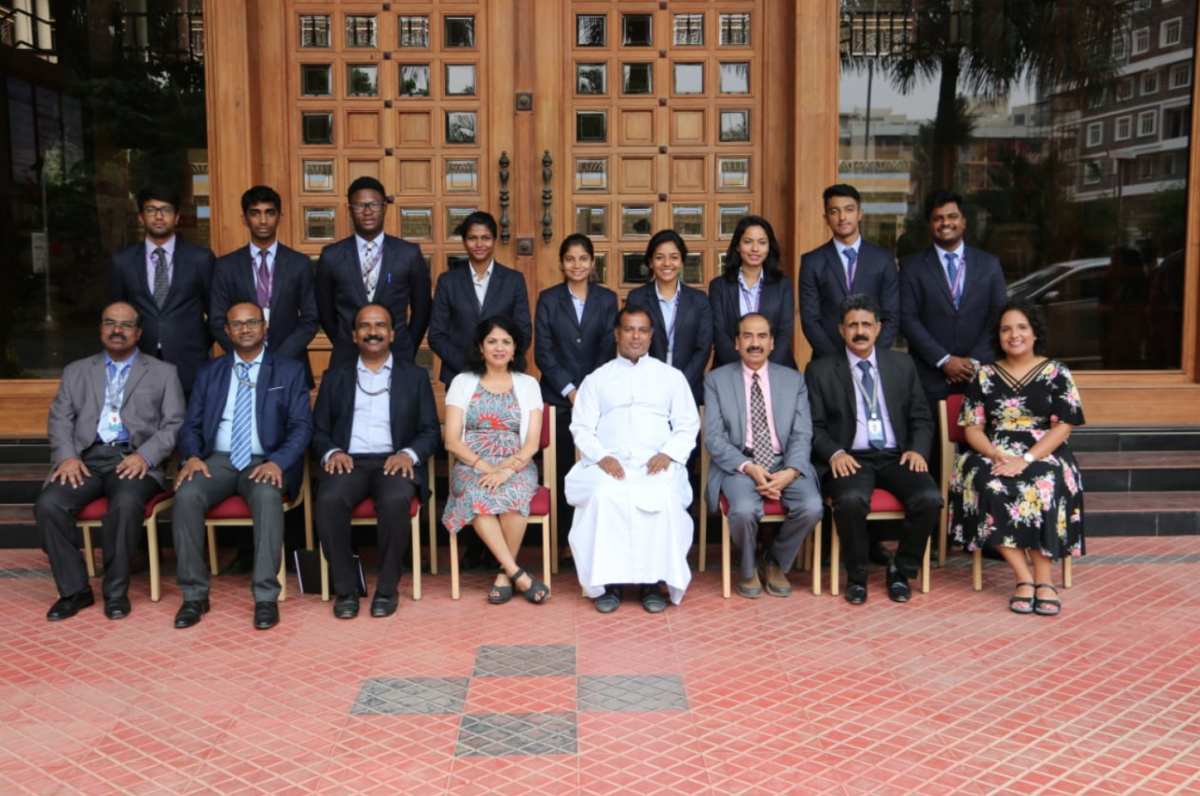
KJC Master students, Program Directors, and Father Augustine
The classes we took covered a wide variety of subjects, from marketing to religions and the culture of India. This gave us great insight on an array of subjects, not just subjects pertaining to Supply Chain Management and Data Analytics. I enjoyed learning about the complexity of the languages, cultures and traditions that live in India.
After a few days of getting settled in and participating in lectures, we started working on our case studies. My Group's task was to analyze data that had been collected from Bank of America, JPMorgan Chase, National Association, and Ocwen Loan Servicing LLC and Wells Fargo & Company concerning mortgage complaints. Our consumer analysis identified certain trends in the data.
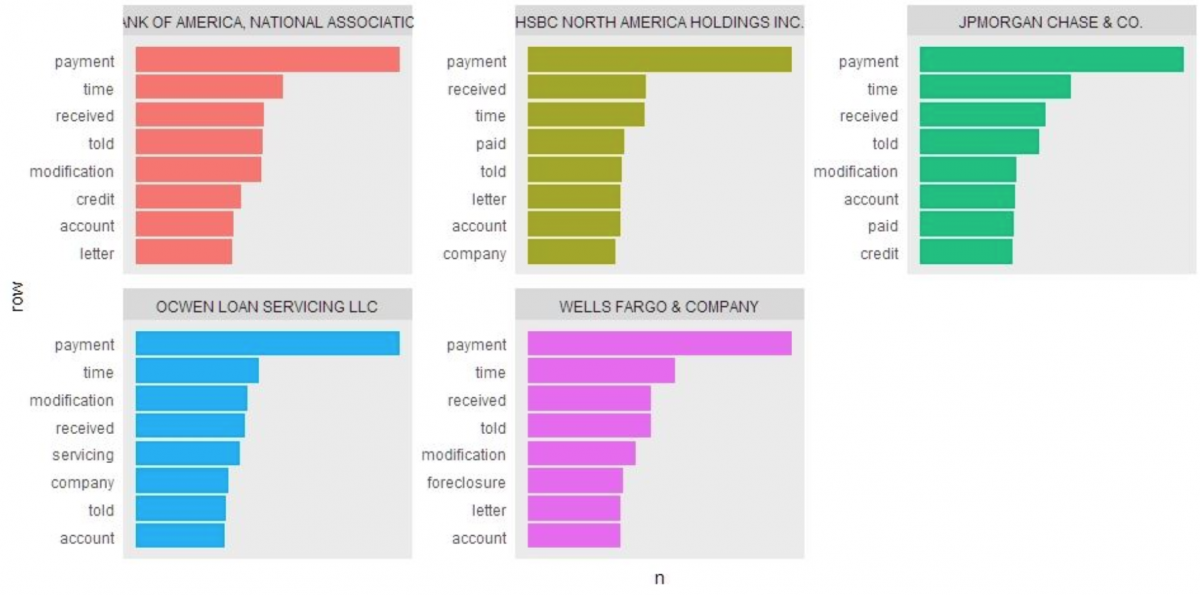
Data displaying recurring themes
The complaints made did not give a clear picture as to the nature of these complaints. Hence the variables could be determined from the comments made in the complaints. Analyzing the data we were able to identify three major variables that kept recurring in most of the complaints i.e. payments, time and modification. These variables were a common feature in the data provided for the five banks and upon further examination, we have come to the assumption that some of these variables were directly in correspondence with each other.
The Analysis Process
We first used Microsoft Excel for a brief exploratory analysis of the data, where we looked at the number of complaints per company, and the distribution and breakdown of the issues field. After this, we exported the data to R in order to run further analyses.
Our first step within R was to prepare the data for text analysis. Since the customer complaints were unstructured we broke each word within a comment out into its own observation. We then cleaned it by expanding contractions, eliminating special characters, converting everything to lowercase type, and removing stop words, short words (three letters or fewer) and unwanted words based on what we were seeing in our exploratory analysis (JPMorgan, Chase, Bank, etc.).
From here, we created a word cloud and bar chart of the tidied data in order to get a feel for what words were appearing most frequently in the data. This was done with each individual bank filtered as well, in order to see if there were noticeable differences. After noting that there were no large differences, we created a list of words by their IF-IDF statistics, to see which words were uniquely common to a company. This gave us the first indication of what unique trends were present in the data between the five companies.
We then reorganized the data from long to wide to facilitate making a data term matrix and model topics from it. We used an LDA (Latent Dirichlet Allocation) package to model five different topics, and then a chord diagram visualization to see which of the companies were contributing the most to each topic. The topics were based on the co-occurrence of words within the data, and the interpretation of topics was left to us to determine. We had the honor to present our findings to a Wells Fargo Data Analyst along with a panel of Professors and Program Directors.
About Walker College of Business
The Walker College of Business at Appalachian State University delivers transformational educational experiences that prepare and inspire students to be ethical, innovative and engaged business leaders who positively impact our community, both locally and globally. The college places emphasis on international experiences, sustainable business practices, entrepreneurial programs and real-world applications with industry. Enrolling approximately 3,000 undergraduates in 10 majors and 175 graduate students in three master's programs, the Walker College is accredited by AACSB International – the premier global accrediting body for schools of business. Learn more at https://business.appstate.edu.
About Appalachian State University
Appalachian State University, in North Carolina's Blue Ridge Mountains, prepares students to lead purposeful lives as global citizens who understand and engage their responsibilities in creating a sustainable future for all. The transformational Appalachian experience promotes a spirit of inclusion that brings people together in inspiring ways to acquire and create knowledge, to grow holistically, to act with passion and determination, and embrace diversity and difference. As one of 17 campuses in the University of North Carolina system, Appalachian enrolls about 18,000 students, has a low student-to-faculty ratio and offers more than 150 undergraduate and graduate majors.
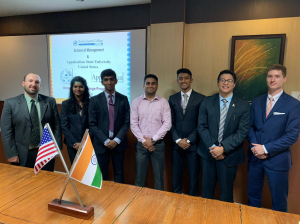
Data Analyst from Wells Fargo (middle), Students from Appalachian State University & Kristu Jayanti College

Photo submitted